Across all dashboards in Moovila, the process for adding custom panels is the same, although the data available will vary. Project Portfolio dashboards offer data associated with all projects (e.g. Projects Forecasted to Complete Late, Projects by Owner, Top Billing Projects), Project dashboards show data associated with the specific project being viewed (e.g. Project Summary, Late Tasks in the Project), and Task dashboards provide data at the task level for all projects (e.g. Tasks Due in the Next 5 Days, Your Overdue Tasks). Each dashboard type provides pre-configured panels, but custom panels are also available to further tailor the dashboard to meet the organization's specific areas of focus.
To add panels to a dashboard:
- Go to the Dashboard view for the Project Portfolio, Project Detail or Tasks by clicking on the View icon and the selecting Dashboard from the dropdown menu.
- The Dashboard view opens. Click the Edit icon in the upper right corner.
- The Edit Dashboard dialogue opens. Click the Add Panel icon in the upper left corner.
- The Dashboard Panel Editor opens. Open the <Please select new panel type> dropdown menu.

- Options for new panel types are organized by data type. In this example, there are Tasks Panels (data around task completion, task acceptance, task ownership, etc.) and Timecard Panels (data around how much time has been entered, who entered the time, what cost code the time is associated with, etc.). Pre-configured panels can be selected and modified, or a custom panel can be created using any available data type. Custom panels allow data presented to be filtered and fully tailored.
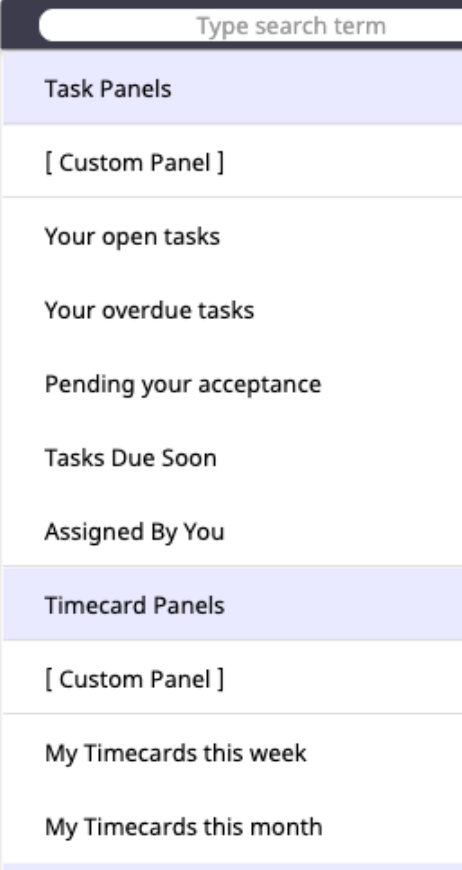
a. To Add a Custom Panel to the Dashboard:
i. Choose the [Custom Panel] option found in the data type section to be used in this panel. In this instance the custom panel will be created using timecard data. 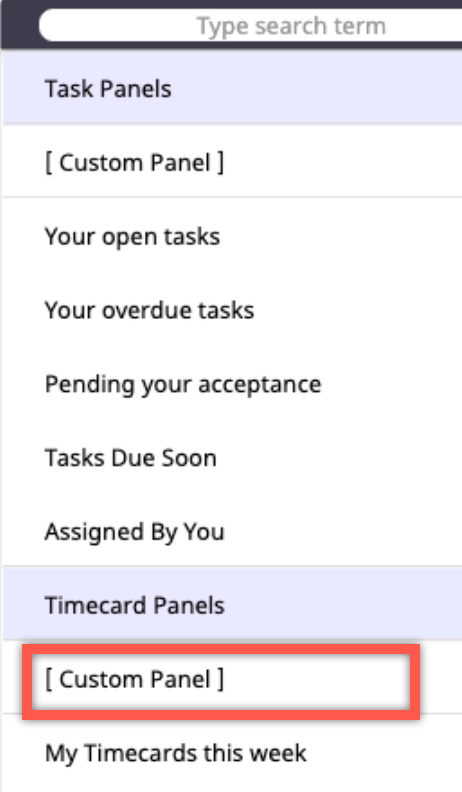
ii. The Dashboard Panel Editor opens showing custom panel options. First, review the filter settings to fine tune the data displayed as needed.

1. Click the Custom Filter Settings button. 2. The Filter panel opens. Options available for filtering will depend on which dashboard you are in (Task, Project Detail, Project Portfolio) and the type of data being used in this custom panel. Select the filter criteria desired for the custom panel using dropdown menus. 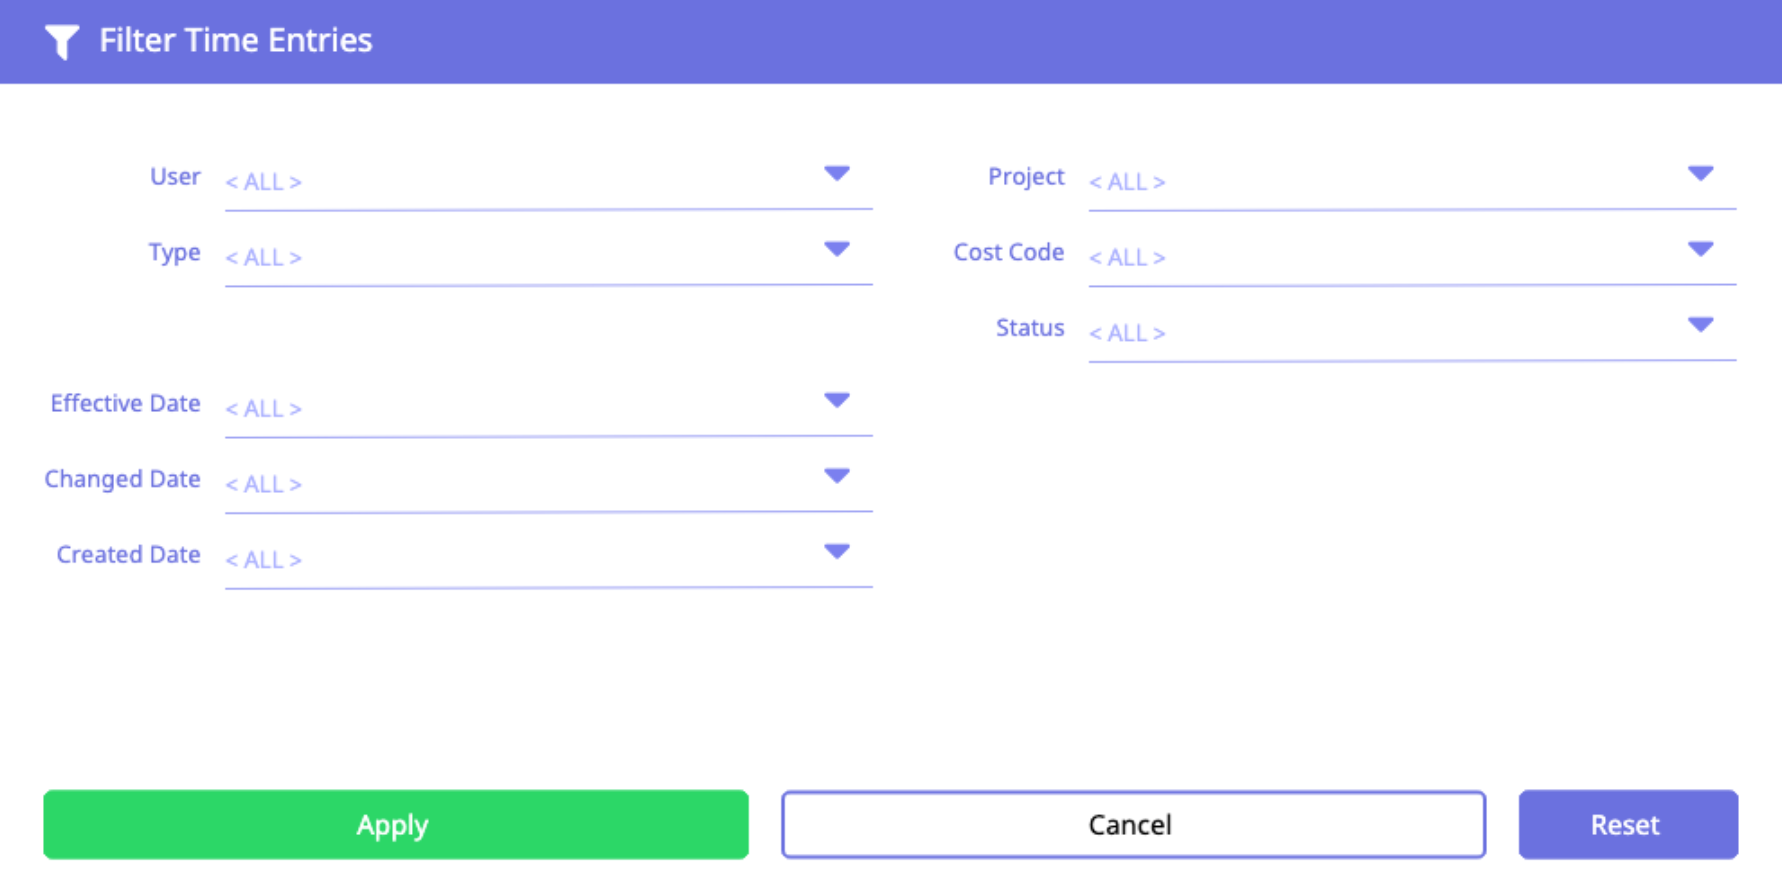
3. Click Apply to save the filter settings. 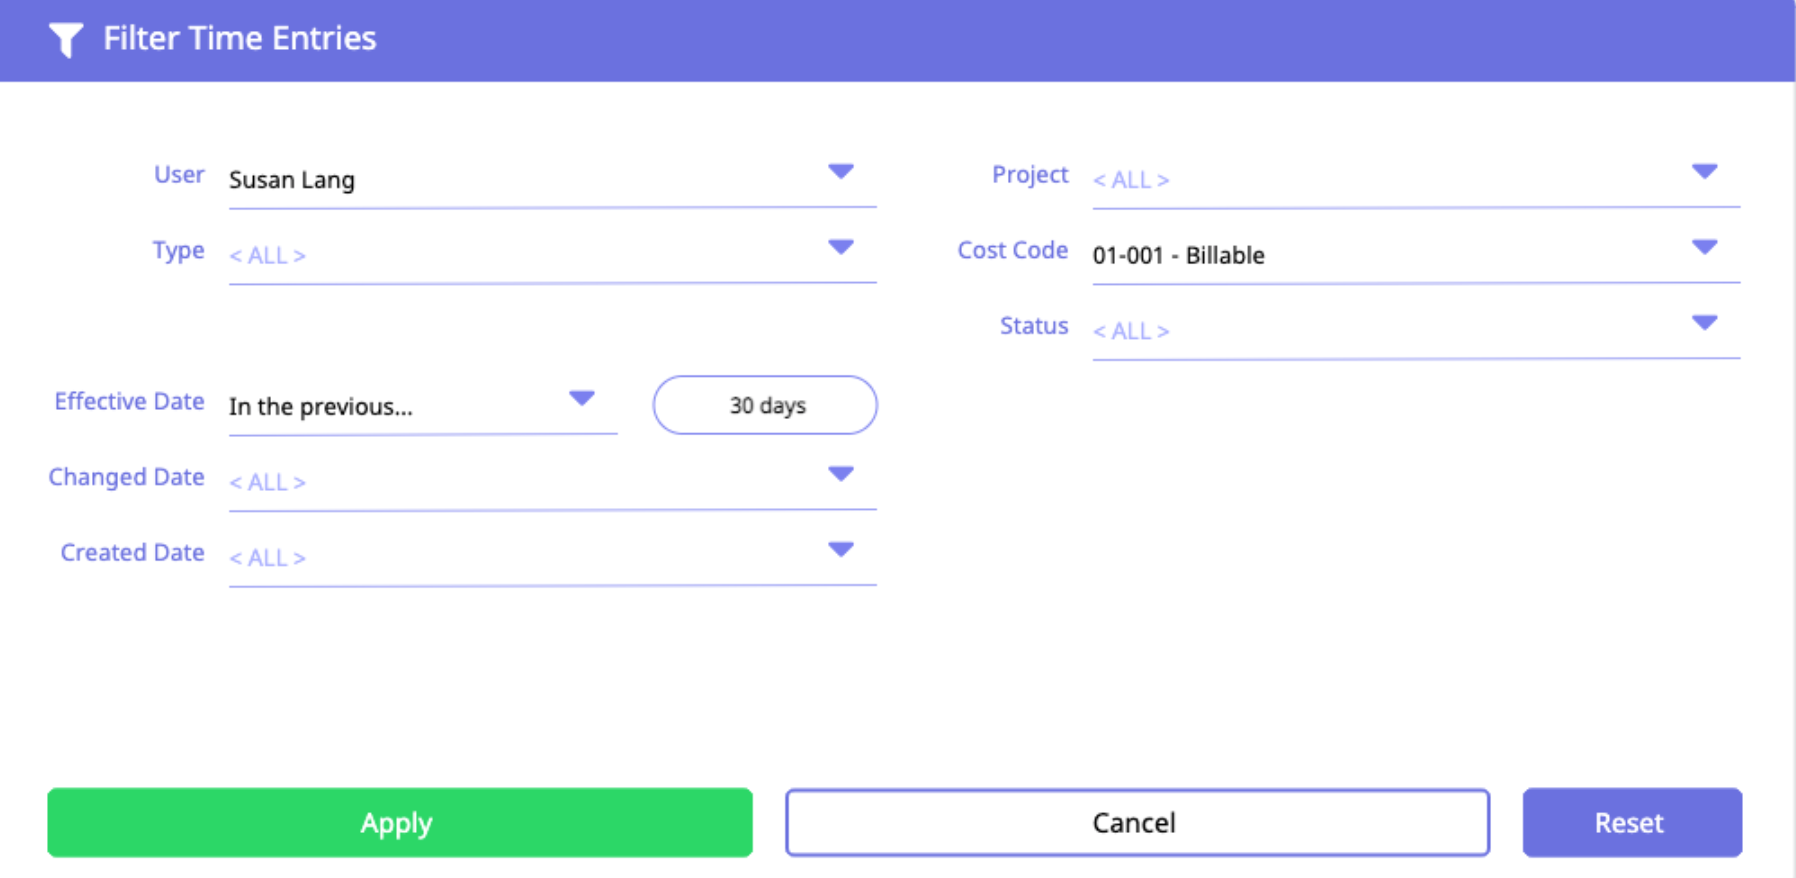
iii. In the Dashboard Panel Editor enter a Panel Title (required) and Description, then select whether you wish the panel to display as a Data Grid or Chart.

b. To Add a Pre-Configured Panel to the Dashboard:
i. Choose a pre-configured panel from available options in the Panel Type dropdown menu. 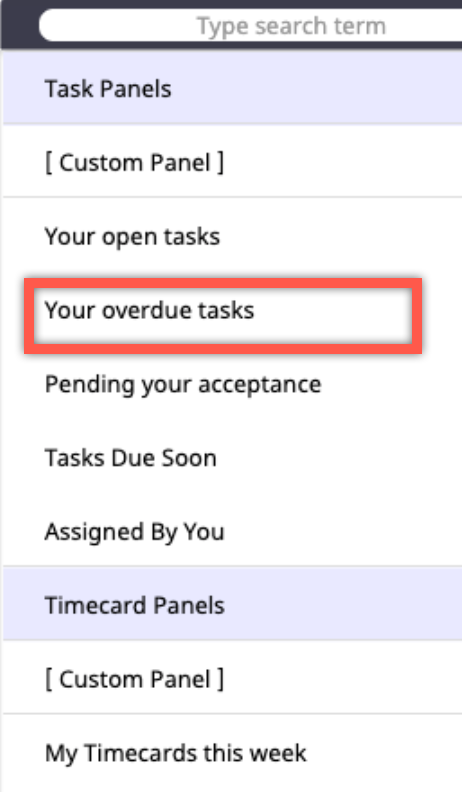
ii. The Dashboard Panel Editor opens with options to edit the Panel Title or Description, and choose to display Panel Content as a data grid or chart. Note that there is no way to edit filter criteria in a pre-configured panel--this option is only available in a custom panel. 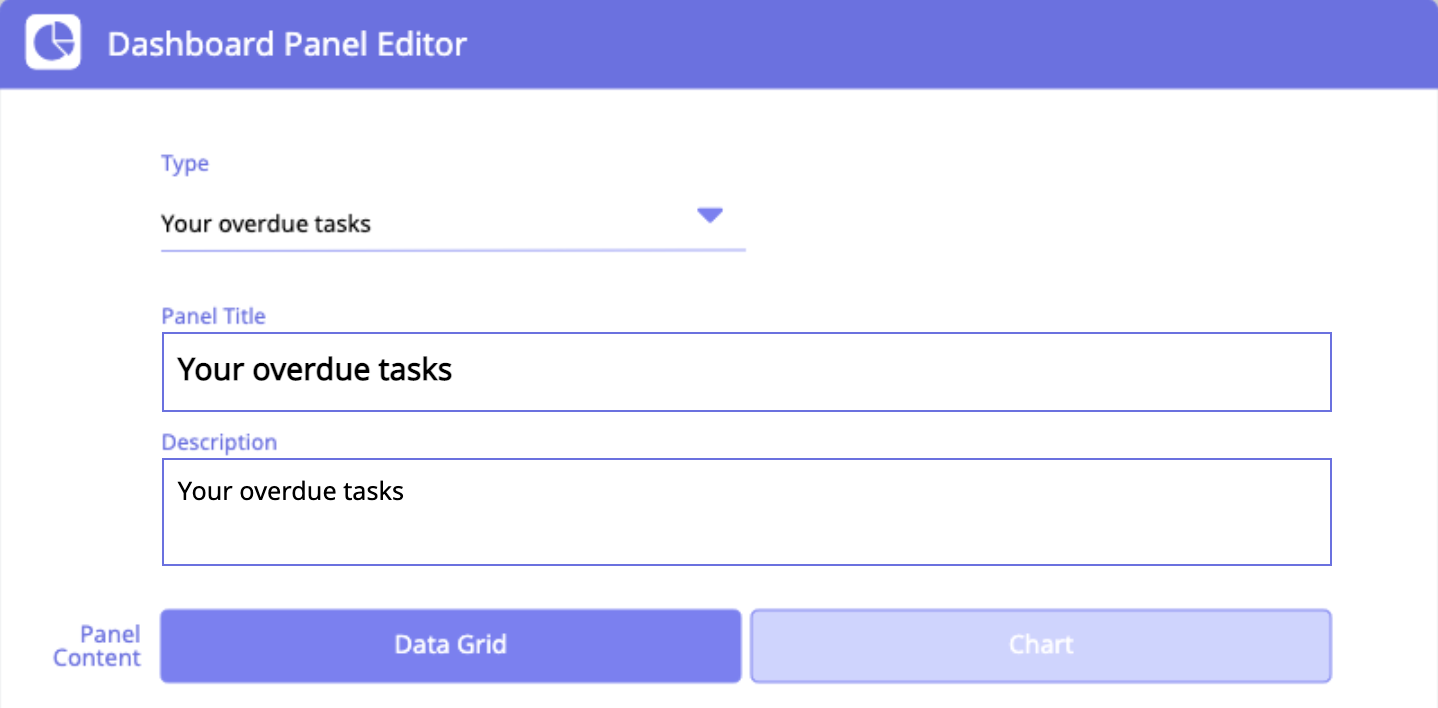
- If moving forward with a Data Grid panel, use the Column Selector dropdown menu to select or the columns displayed. Use the Panel Footer buttons to add either Totals or Averages to the bottom of numerical columns.

- If moving forward with a Chart panel, first select the Chart option for Panel Content. Select a Chart Type, Chart Group, and Chart Sum. Click Apply to save changes and save the panel.

- Click Apply to save changes and create the panel.
- The new panel will appear in your dashboard. While still in Edit mode, the panel can be dragged and dropped into a new position within the layout. Click Save to save these changes.

Comments
0 comments
Please sign in to leave a comment.